 by Tega Akuruli
Graphics in Scientific Visualization Nobody Talks About
Understanding Scientific Visualization
Scientific visualization is described as the activity of mapping, processing, and rendering information from complicated data through graphics. Whereas traditional graphics emphasized aesthetics, scientific visualization focuses on clarity, accuracy, and insight. It is the process of taking numerical, experimental, or simulation data and converting it into visual representations understandable to humans.
From climate simulations and astrophysical models, to molecular dynamics and fluid mechanics, scientific visualization allows researchers to:
- Identify patterns and trends
- Validate computational models
- Communicate findings to other scientists or the public
It may be somewhat less glamorous than some other applications of graphics, but it is a foundation of modern science, engineering, and data-driven research.
The Core Role of Graphics in Scientific Research
Graphics in scientific visualization have several purposes:
1. Translation of Abstract Data
Many scientific datasets are multidimensional, time-dependent, or non-intuitive, including:
- Molecular structures
- Weather conditions
- Astrophysical simulations
- Brain activity scans
Graphics convert these abstract forms into visual representations—charts, heatmaps, 3D renderings—that humans can interpret.
2. Improving Pattern Recognition
Humans are visually adept at detecting patterns. Scientific graphics exploit this capability, allowing researchers to:
- Find Correlations in Data.
- Detect anomalies or outliers.
- Understand complex interactions between variables.
These patterns may remain hidden without visualization in raw data tables.
3. Presenting Results
By applying scientific visualization, results can be communicated effectively. Graphical representations are more comprehensible for stakeholders, policy makers, or the public than raw numbers or formulae.
Applications Across Scientific Fields
1. Physics and Engineering
Simulations in the fields of fluid dynamics, electromagnetic fields, and structural stresses utilize visual representation to interpret results. For instance,
- CFD can be used to visualize the airflow over wings or the water current in rivers.
- Finite Element Analysis: Mapping stress and strain in materials
- Electromagnetic Fields: Displaying field strengths and interactions in 3D
It would be much harder to interpret these complex phenomena without visualization.
2. Biology and Medicine
In the end, visualization is essential to life, from cellular processes to organ systems, at several different scales:
- Molecular structures and protein folding
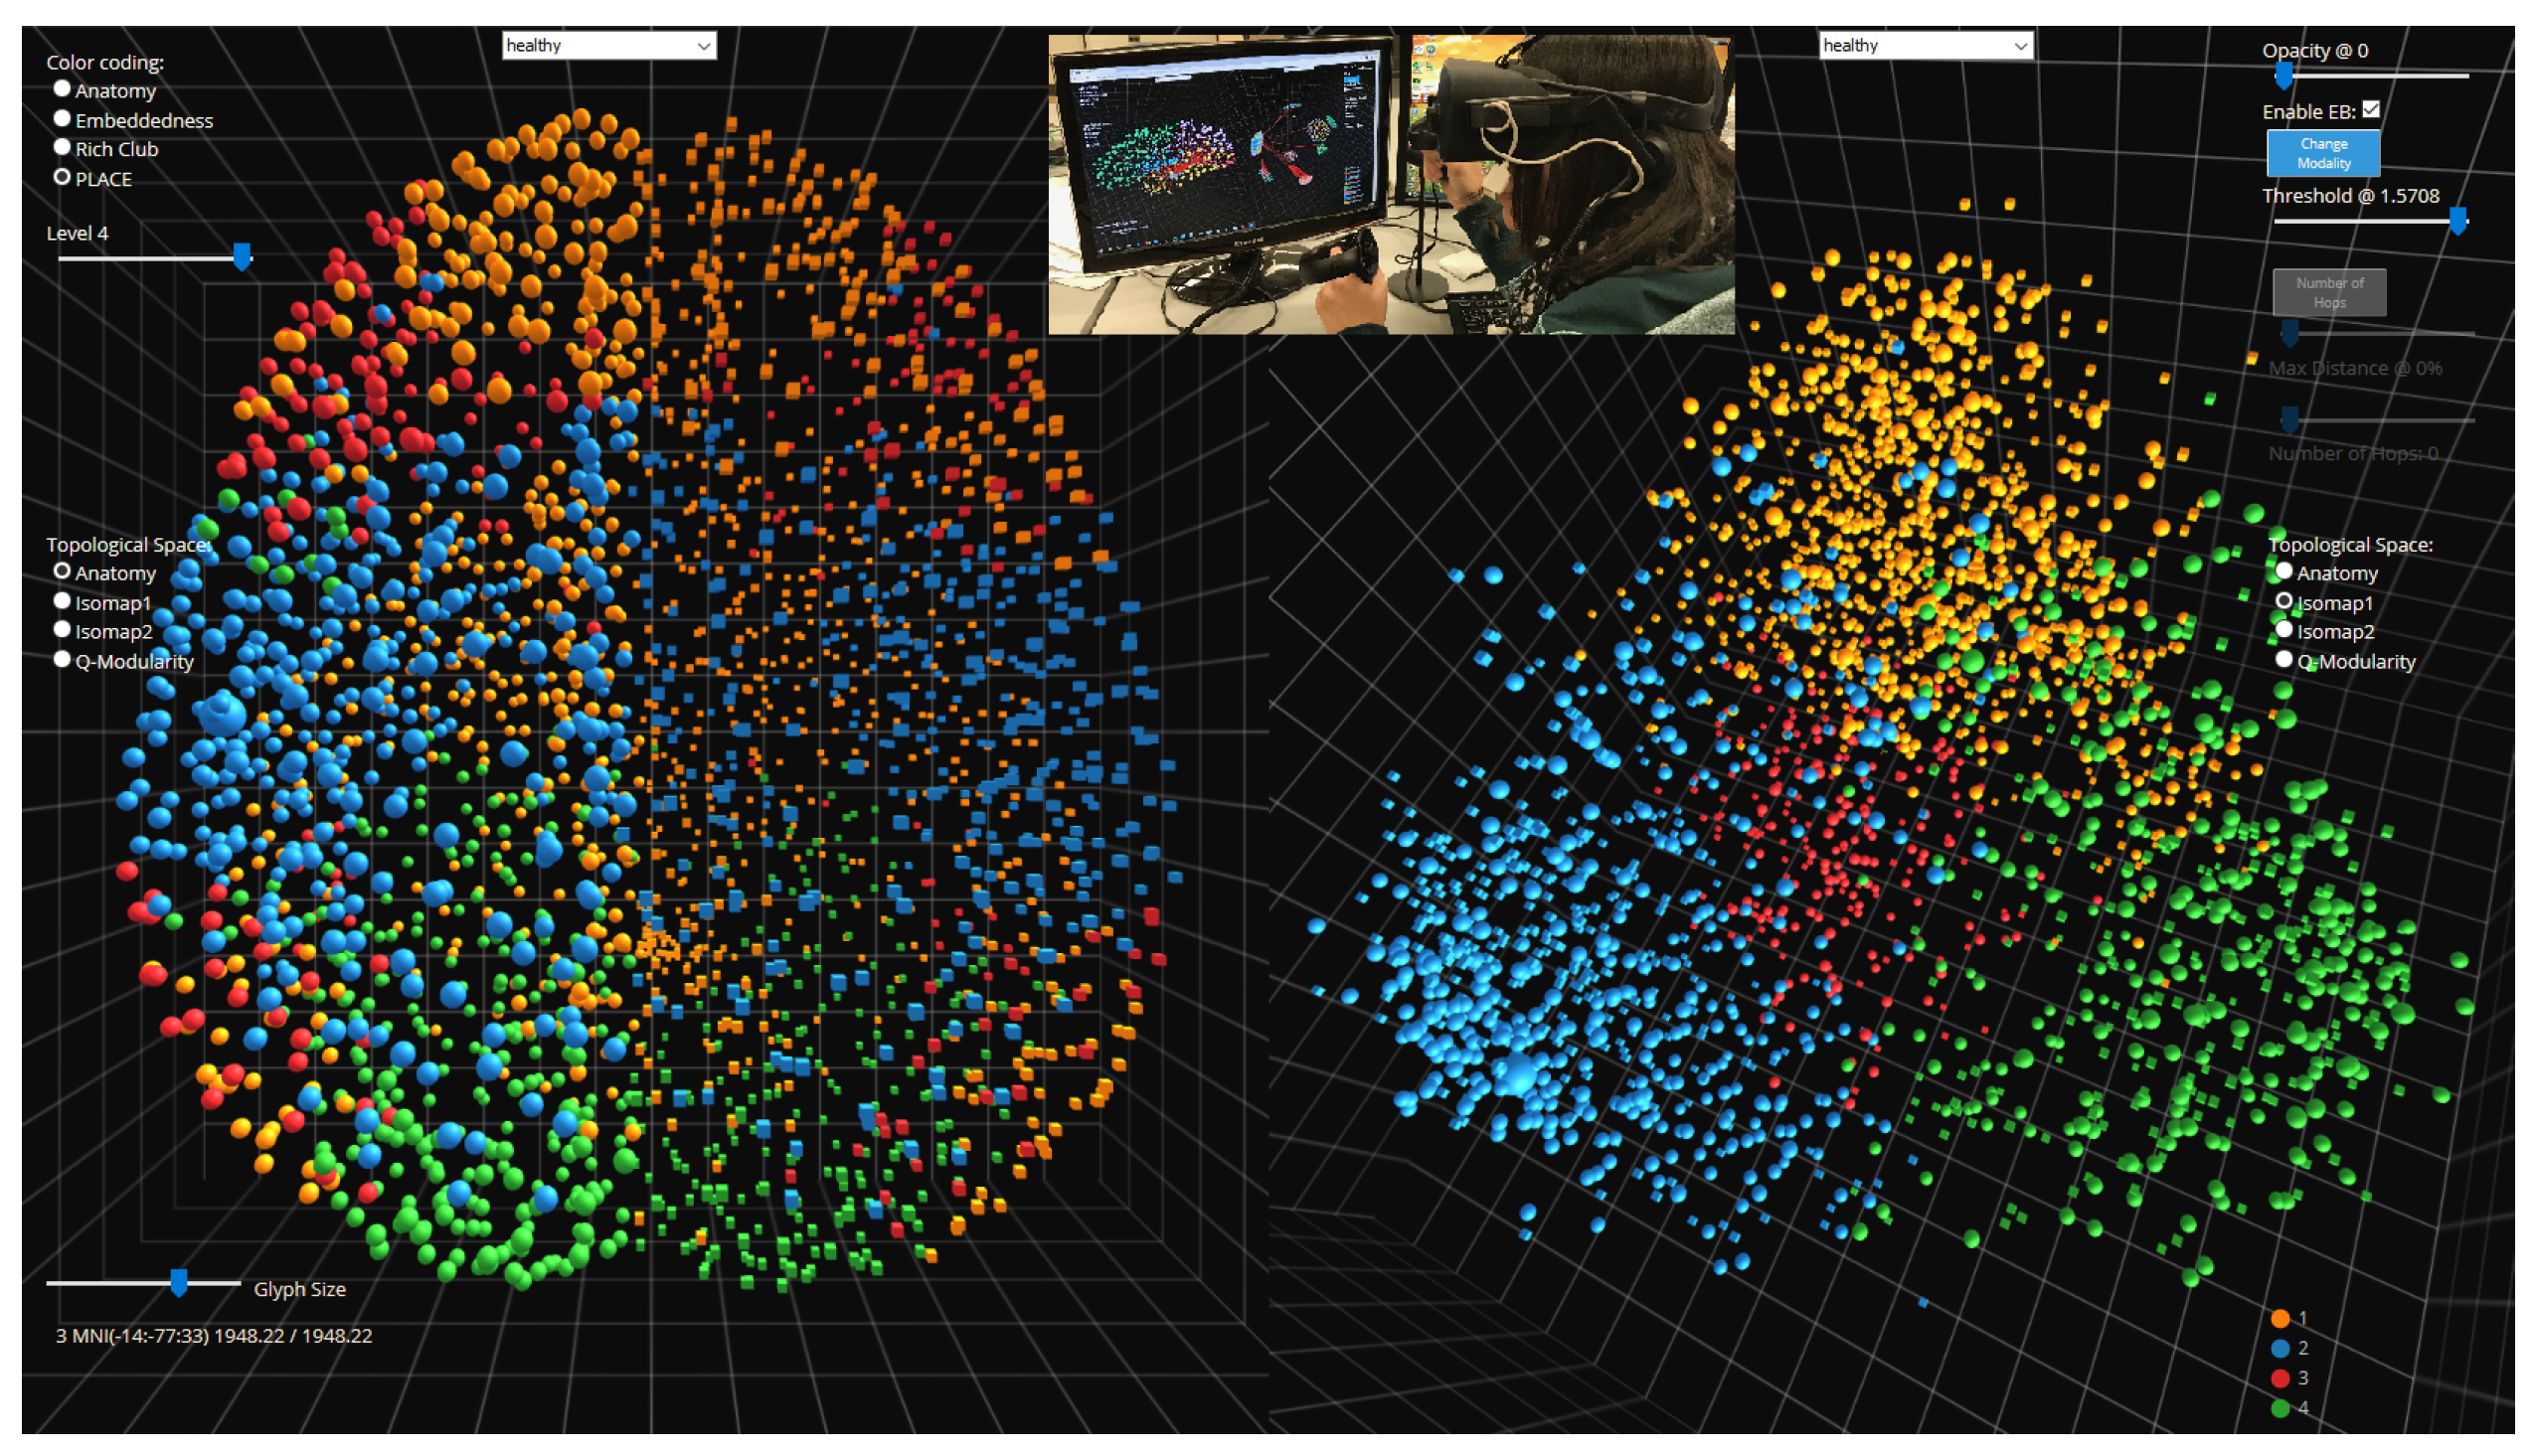
- Brain connectivity and neural activity mapping
- Imaging modalities such as MRI, CT, or PET scans
Medical researchers use graphics for various tasks other than analysis: surgical planning, diagnosis, and patient education.
3. Environmental and Earth Sciences
Visualization is essential for bringing out the trends and predictions in climate models, geological surveys, and ecological data.
- Climate simulations showing temperature changes over decades
- Ocean currents and pollution mapping
- Geological formations for earthquake risk assessment
With interactive 3D visualizations, researchers can view data from multiple perspectives, a process that provides insights not possible with static charts.
4. Astronomy and Astrophysics
The universe is too vast to comprehend through raw data alone. Scientists use graphics to:
- Render simulations of galaxy formation.
- Visualize star systems or exoplanet trajectories.
- Interpret data from telescopes into understandable images.
This makes the invisible cosmos visible, meaning one can make discoveries and explore beyond their immediate observation.
The Technical Backbone of Scientific Visualization
Scientific visualization often combines computational graphics, mathematical modeling, and data processing pipelines.
- Data preprocessing involves cleaning, normalizing, and structuring the raw data.
- Mapping Algorithms: These algorithms transform numerical data into visual elements, such as color, shape, or 3D surfaces.
- Rendering Pipelines: High-quality visuals are generated through the GPU or customized software.
- Interactivity: Researchers can interactively change visualizations in real-time using tools like ParaView, MATLAB, or custom-written OpenGL/DirectX applications.
It is not purely aesthetic, for visualization also requires precision, reproducibility, and technical rigor.
Challenges in Scientific Visualization
While critical, visualization faces some unique challenges:
1. Big Data
Today’s research produces data sets measured in terabytes, sometimes petabytes, and it needs to be processed and rendered via efficient pipelines.
2. High Computational Demands
The rendering of detailed 3D simulations, animations, or interactive visualizations requires powerful GPUs, memory, and parallel processing.
3. Accuracy vs. Interpretability
Visualizations must strike a balance:
- Too much abstraction tends to mislead or oversimplify.
- Too much detail may overwhelm or confuse.
A permanent challenge is to achieve clarity without compromising scientific accuracy.
4. Multidisciplinary Collaboration
Effective visualization often necessitates the interaction between:
- Domain scientists
- Data analysts
- Graphics programmers
- UX professionals
Bridging these disciplines requires communication and technical flexibility.
The Future of Scientific Visualization
The field is fast evolving, driven by rapid technological changes:
- Real-time interaction: The researcher can change the simulation interactively at runtime to dynamically explore various scenarios.
- VR/AR Integration: Immersive experiences for molecular modelling, architectural simulations, or astronomical explorations.
- AI-Assisted Visualization: Machine learning algorithms automatically help in highlighting patterns, anomalies, and predictive insights.
- Cloud Computing Collaboration: Teams from all over the world will be able to collaborate and visualize massive data collaboratively.
Scientific Visualization will continue to be a cornerstone in discovery as it makes the unseen visible and data into actionable insight.
To Sum It Up…
Scientific visualization graphics are ubiquitous, yet of absolute importance to modern research: they transform raw, complex information into visual narratives that are interpretable, interactive, and actionable. From medicine to astrophysics, from climate science to engineering, visualization is the unsung hero enabling understanding and discovery. Without it, the efforts of modern science to communicate insight, discern patterns, or explore phenomena too complex or large for raw data would be hard.